What Is P Value For Statistical Significance
In this article we will discuss the topic of P-Value, What Is P Value For Statistical Significance? and this article clarifies the basic concept of p-value in statistics with the help of some relevant examples.
What is the P-value?
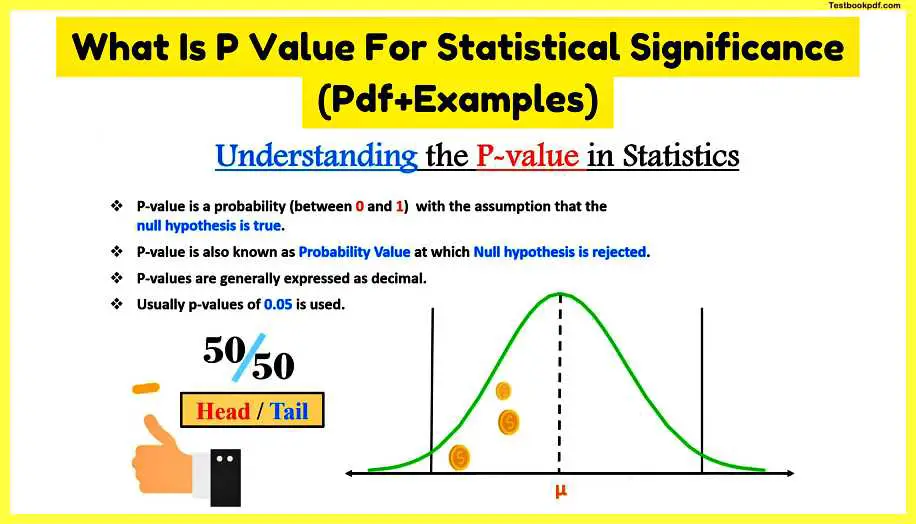
The P-value is a statistical measure of how significant a result is. In science, the p-value is the probability of obtaining a result at least as extreme as the actual result if the null hypothesis (the assumption being tested) were true. A low p-value indicates that the data strongly supports the rejection of the null hypothesis.
P-values are commonly reported in scientific papers and are often presented graphically. The p-value is calculated using the following formula:
p 1 – F(x), where x is the value of the test statistic.
For example, suppose we want to determine whether the mean weight of male mice is greater than the mean weight of female mice. We have two groups of mice, each consisting of 10 males and 10 females. The mean weights of the two groups are 14 grams and 13 grams respectively. If we use the t-test, we would calculate the p-value as follows:
t (14 – 13)/sqrt((10*10 + 10*10)*0.05).
This gives us 0.898, which means that the difference between the two means is not statistically significant.
If we instead use the Mann-Whitney U test, we would calculate the U-statistic as follows:
U (14 – 13) / sqrt((10*10) * 2.5).
This gives us 4.9, which is less than 5.99, so we reject the null hypothesis.
P-value from a statistical perspective
P value is the probability of a number between 0 and 1 calculated under the assumption that the null hypothesis is true p-value is evidence against a null hypothesis.
- In statistics p-value is also known as the probability value it is the smallest level of significance at which the null hypothesis is rejected.
- The p-value is generally expressed as decimals although it may be easier if you convert them into percentages – the smaller the p-value stronger the evidence that you should reject the null hypothesis.
- Usually, the p-value of 0.05 is used so if you convert this into a percentage, it comes to five percent which means that there is a five percent chance that your result could be random that is it would have happened by chance, on the other hand, the larger p-value – for example, 0.9 means that your result has 90 percent probability of being completely random and not due to anything in your experiment, therefore, smaller p-value more the significance your result would be.
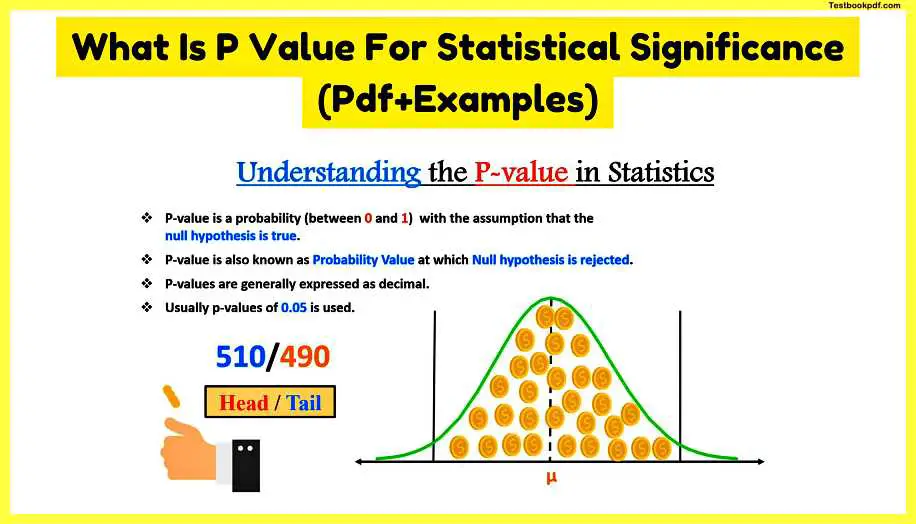
Let’s say an experiment is performed to determine if the coin flip is fair or not so you flip the coin you have an equal probability of getting a head or tail that is 50 or 50 or 0.5 now suppose you flip the coin 1000 times it follows a normal distribution curve and on an average, we would expect to have 500 tails and 500 heads but if I got 510 head and 490 tail then do would you call this a fair coin or an unfair coin.
But in this case, we can say there is no sufficient evidence to suggest that the coin is fair or not right so if again we get another case where we have 800 heads and 200 tails would you still call this coin a fair coin?
I guess we cannot call this a fair coin because we would have a strong suspicion that this is an unfair coin and is biased towards the head so in this case, we would suspect the coin is biased and this could be easily happening by chance.
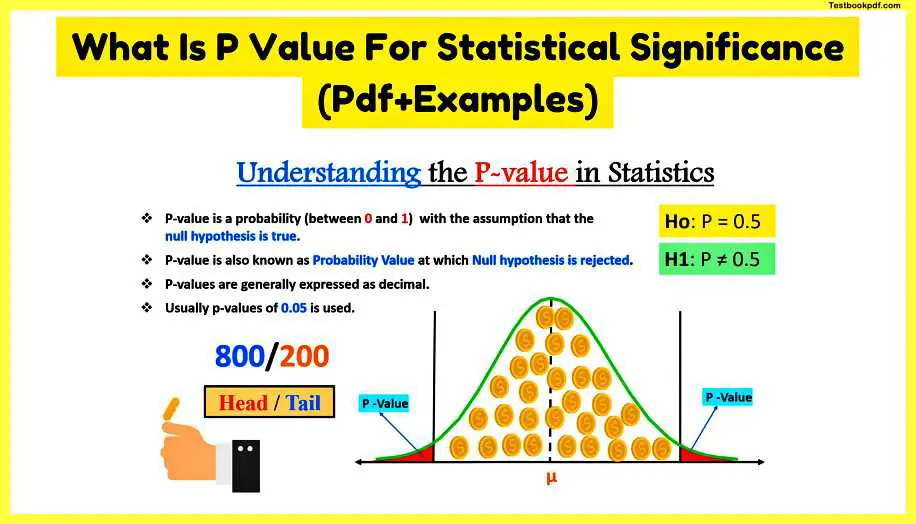
Graphically if you represent the p-value it is the area in the tail that is the red area that I have marked that is the description of your graphical distribution my null hypothesis in this coin would be that my coin is fair and it should have equal probability it is a default of worst case scenario it is a known fact that it will have 50 head and 50 tail and my alternate would be that is not 0.5 that is how you define the alternate and null hypothesis, in this case, the chance of occurrence of null and alternate are mutually exclusive this means then either of them can occur both cannot occur at the same time that is basic about the p-value.
Let us look at some decision rules and how based on that we will evaluate whether our result is significant or not decision rules to understand the decision rules.
Decision Rules
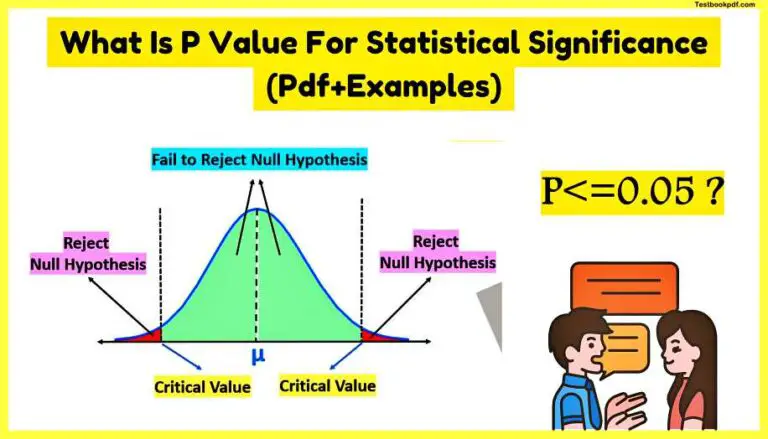
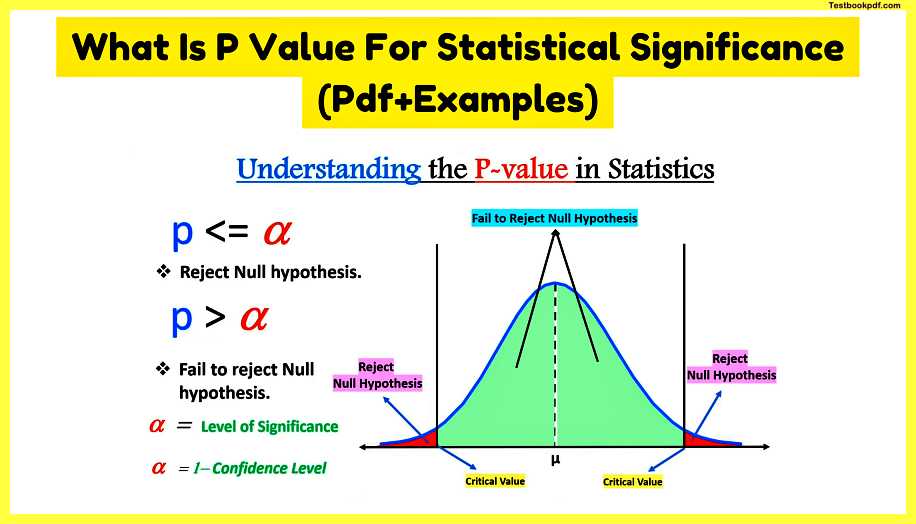
let us first plot the normal distribution curve and these are my critical values.
First rule
Now my first rule says if p is less than alpha (p<=α) that is the significance level then we can reject the null hypothesis if it falls in this red region which is below the critical values the term significance here means not anything major important but it just means the difference between two mean is not likely due to chance and as the p gets further lower the evidence allow you to reject the null hypothesis gets stronger here.
Second rule
The second rule is if p is greater than alpha (p>α) that means we fail to reject the null hypothesis which falls in this green region here the p-value lies between zero and one it won’t reach exact one because in real life the group will probably not be exactly perfectly equal and it also not reach zero because there’s always a possibility even if it is extreme So alpha here denotes the level of significance and how you calculate you calculate form 1 minus confidence level here.
Example 1: Single Population Mean
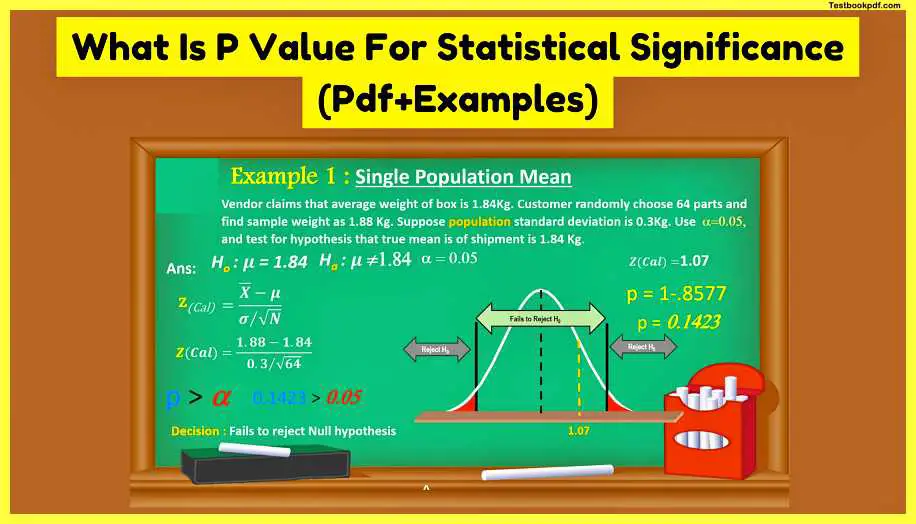
Q: The vendor claims that the average weight of the box is 1.84 kg the customer randomly chooses 64 parts and finds the sample width as 1.88 kg suppose the population standard division is 0.3 kg with alpha at 0.05 that is the level of significance we need to test for the hypothesis that the true mean of shipment is 1.84 kg?
A: So my null hypothesis is that mu is equal to 1.84 kg and r10 is it is not equal to 1.84 kg alpha or level of significance as 0.05 so let’s plot it on that normal distribution curve we mark it the area rejection area here if it falls in the red region we will reject our null hypothesis if it falls in between we fail to reject the null hypothesis so we’ll use the z formula that is x power minus mu by sigma by under root n we’ll put all this value here we get z calculated as 1.07
When we go back to the z table here we find out what is 1.07 to 1 from the z table on the last column and o7 from the vertical column so we get 0.857 so this entry in this table is the standard normal curve to the left of the z value.
That means I am getting p as one minus point eight five seven seven since the normal distribution is symmetrical so the area to the right of the curve is equal to that of the left that is why we have created one minus point five and we get p as 0.1423
So, in this case, my p is greater than alpha which is 1.4323 is greater than o 5. so since p is more than the significance level so our decision will be to fail to reject my null hypothesis here this is how we do it based on the p-value.
Example 2: single population proportion
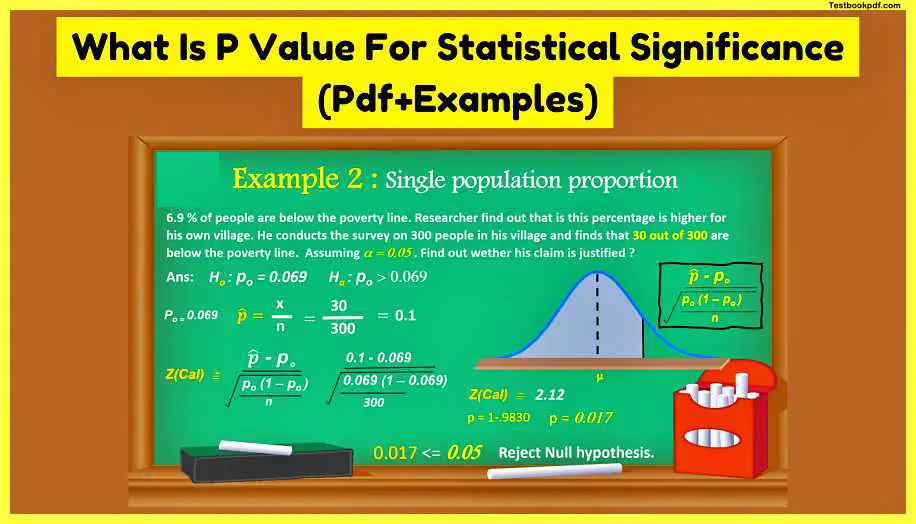
Q: 6.9 percent of the people are without the poverty line researchers find out that this percentage is higher for their own village he conducts a survey on 300 people in his village and finds out that 30 out of 300 are below the poverty line. assuming the alpha of 0.05 we have to find out whether his claim is justified or not.
A: So my null hypothesis is p naught equal to 0.069 which is coming from 6.9 percent of the population alternate hypothesis is p naught is greater than 0.069 since his claim is that his percentage is higher in his village so we use this formula for calculating z calculated that is p hat minus p naught divided by under root of p naught into 1 minus p naught divided by n where p naught is equal to 0.069 p hat is x squared by n so x is 30 the result that he got out of 300 samples in his village and p hat is coming as 0.1 now we will put these values in of p hat p naught in the z kilowatt formula we get z calculated as 2.12
Go back to the z table but first let us plot this in the normal distribution curve in the z table we will find out 2.12 which comes at an intersection of 2.1 and 0.002 we get 0.9830
So this is 0.9830 since the area under the curve is 1 we subtract it from 1 so we get p as 0.017 since this 0.007 is less than 0.05 that is significance level alpha so we reject the null hypothesis, in this case, this is another example of p-value so I hope with this you now have very good understanding about p-value.
So if you like this article share it with your friends, thanks for reading.
